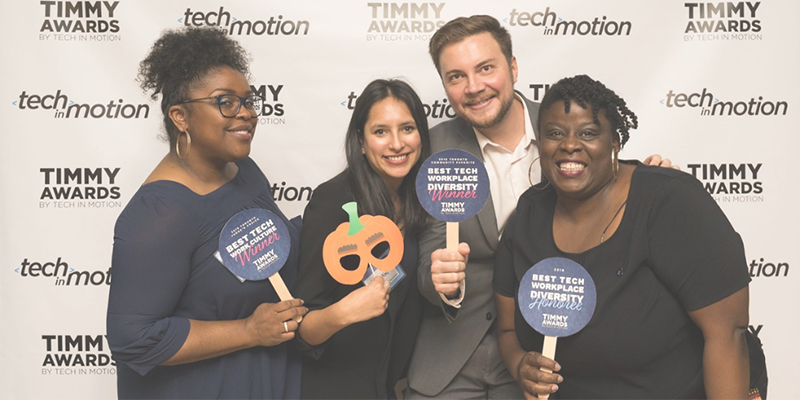
Back to Blogs

Cumulative Flow Diagrams: An Alternative to Burndown Charts

  • Publish Date: Posted over 9 years ago
  • Author: Craig Denney

Cumulative Flow Diagrams: An Alternative to Burndown Charts

Before, or shortly after, most Scrum projects start, the topic of metrics is discussed. Scrum defines two metrics to use: the Release Burndown chart and the Sprint Burndown chart. This post presents another option: the Cumulative Flow Diagram.

A burndown chart is a graph used to track a team’s release or sprint progress and estimate how much time remains to complete the project or sprint. The number of user story points on the backlog (Release Burndown) or task hours remaining in the sprint (Sprint Burndown) is typically plotted on the y-axis, and time is plotted on the x-axis.

Cumulative Flow Diagrams: An Alternative to Burndown Charts

An advantage of a burndown chart is that they are simple to read and allow stakeholders to easily track the progress of a project.

However, burndown charts do have some disadvantages. For example, the graph might show a straight horizontal line indicating lag during a period of time, but that might have been due to several team members taking time off, or there may have been additional tasks required to complete a user story before the story  could be considered “Done” at the completion of a Sprint. Another disadvantage of burndown charts is that they only reflect the user stories/tasks that have been completed (“Done”) and not those that are work in progress (WIP).

In contrast to a burndown chart, which tells us how much task work (at the sprint level) or project scope (via the project backlog) is not complete at a particular time, the cumulative flow diagram is an indicator of how the Scrum team is performing in terms of delivering value. Instead of tracking the rate at which the team is completing the backlog (the traditional Release Burndown), the cumulative flow diagram enables stakeholders to measure how efficiently the Scrum team is delivering valuable, working product to the customer, and indicates where the team needs to focus their process improvement efforts (great conversation starters for team Retrospectives).

To overcome the limitations of a burndown chart, Scrum teams can provide stakeholders better information by using a cumulative flow diagram (CFD) that presents a visual indication of the status of the project team’s performance for a given moment in time.

Cumulative Flow Diagrams: An Alternative to Burndown Charts

In CFDs, we plot the size of the total backlog at the beginning of the project (in story points), work in progress and tasks that have been completed. The user story points are plotted on the y-axis, while time is plotted on the x-axis. CFDs are more visually informative of the project team’s activities and progress in completing the project/sprint backlog.

The CFD provides a graphic depiction of user stories moving through various states on the way to being “Done”. It shows stakeholders the total scope of the project, grouped by states, and allows stakeholders to know how much of the project scope is in a particular state at a given time.

A cumulative flow diagram allows stakeholders to determine:

  • Whether or not value is being delivered; are stories “Done”?

  • Where the bottlenecks are in the process workflow: Is work backing up in a particular state? If so, there is a bottleneck downstream of that state?

  • How long it takes for value to be produced (cycle time): How long does it take to go from entering the initial state to entering production (lead time)?

  • If the scope of the project is changing: Is the total size of the backlog (the sum of all of the scope, regardless of state) constant, increasing, or decreasing?

Because CFDs plot the total scope and the progress of individual User Stories and tasks, they communicate progress and visually provide an indication of overall project completeness. CFDs offer a simple method of tracking work-in-progress and promote analyzing trends in lead time for delivery of working code. CFD’s also provide a metric that allows project teams and stakeholders to adapt early to growing problems and provide transparency into the whole solution development lifecycle.

The cumulative flow diagram is an extremely valuable Scrum management report. It provides an informative picture of key process variables such as velocity, WIP and cycle times. CFDs can assist the stakeholders and the Scrum team to release more features faster by identifying bottlenecks and problems in the project, development and testing processes.

Have any questions or comments? Leave them below.

Note: Diagrams from Version One.

Learn about our Agile Solutions